All services Services

Property Resources

Property data presented in a more meaningful way. Cut through the noise with clear, visual insights that show what's really driving each market.

Markets within markets

There is no one Melbourne property market.

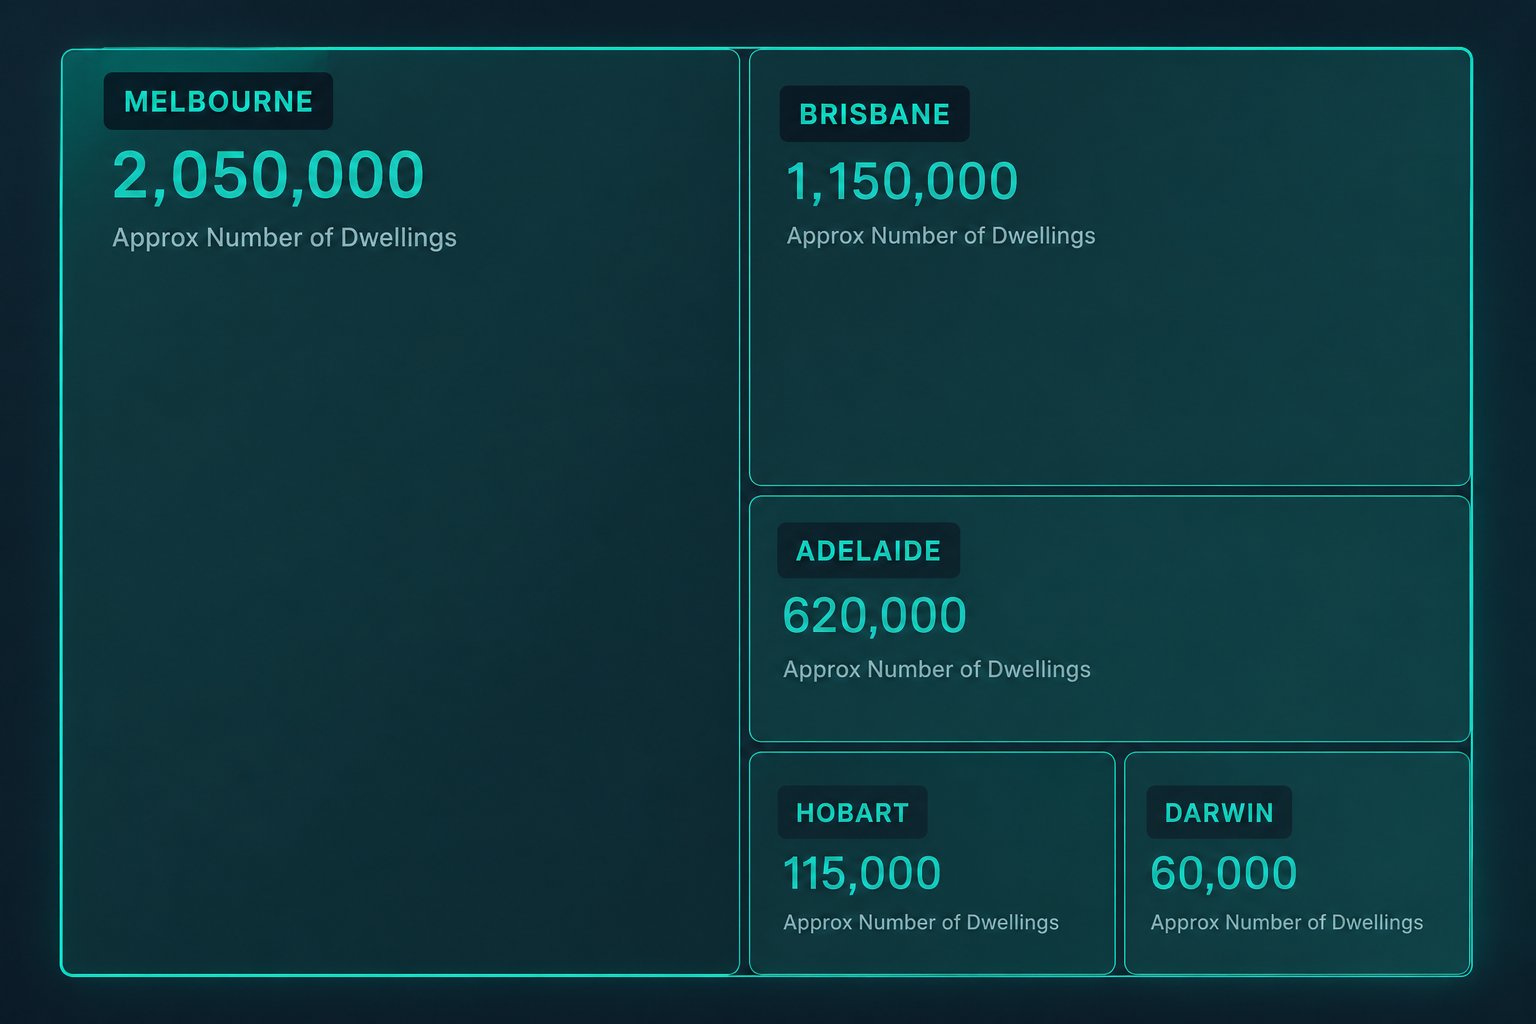
Melbourne is so large that the entire dwelling stock of Brisbane, Adelaide, Hobart, and Darwin would fit comfortably inside it. Treating "Melbourne" as a single market is a mistake. The data only makes sense once you drill into the markets that sit within it.

Approximate dwelling counts: Melbourne 2,050,000; Brisbane 1,150,000; Adelaide 620,000; Hobart 115,000; Darwin 60,000. Combined, Brisbane, Adelaide, Hobart and Darwin fit inside Melbourne's total dwelling stock.

The takeaway: you can't make a single call on "Melbourne". There are markets within the market, and that's where the work happens.

Wondering which market a property really sits in?We read suburbs at the level that actually drives growth.

Book a free call
Areas to avoid

Suburbs with heavy incoming building supply.

When new dwelling supply hits a market faster than demand can absorb it, capital growth stalls. These growth-corridor suburbs sit on top of active development pipelines. They often look attractive on paper, but the supply overhang suppresses long-run prices.

Melbourne
  • Fraser Rise – Plumpton
  • Tarneit – North
  • Rockbank – Mount Cottrell
  • Whittlesea
  • Cobblebank – Strathtulloh
  • Wyndham Vale – North
  • Eynesbury – Exford
  • Mickleham – Yuroke
  • Tarneit (West) – Mount Cottrell
Brisbane
  • Ripley
  • Chambers Flat – Logan Reserve
  • Greenbank – North Maclean
  • Morayfield
  • Yarrabilba
Perth
  • Alkimos – Eglinton
  • Brabham – Henley Brook
  • Baldivis – North
Sydney
  • Box Hill – Nelson
  • Austral – Greendale
Adelaide
  • Virginia – Waterloo Corner
  • Munno Para West – Angle Vale

Not sure if a suburb is facing an oversupply?We check the development pipeline before you commit.

Book a free call
Why yield matters

Capital growth builds wealth. Yield keeps you in the game.

Gross yield is the annual rent divided by the purchase price. It tells you how much of the holding cost the property pays for itself. Buy a strong-growth suburb with weak yield, and the monthly shortfall can force you to sell before the growth ever arrives.

Gross yield = annual rent ÷ purchase price

Worked example · $600,000 property

4% gross yield
Purchase price $600,000
80% loan · 30 years · 6.6% $480,000 loan
Monthly mortgage −$3,065
Rent income · $460/week +$1,993

Monthly holding costs

Property management−$170
Council rates−$137
Land tax−$110
Insurance−$100
General maintenance−$100
Water rates−$75
Total monthly outgoings −$3,757
Rent received +$1,993
Out of pocket, every month −$1,764

The point: at a 4% yield this property costs over $1,700 a month to hold, before any vacancy or rate rise. A higher yield shrinks that shortfall and lets you hold long enough for capital growth to do its work. We screen every recommendation on both growth and yield, so the numbers stack up the whole way through.

Try it yourself

Cashflow calculator.

Plug in your own numbers to see the gross yield and the monthly cashflow position. Nothing is stored or sent anywhere. It all runs in your browser.

Your property

Enter the deal you're weighing up.

$
%
%
yrs
$
Monthly holding costs
$
$
$
$
$
$
4.0%
Gross rental yield
Loan amount$480,000
Monthly mortgage−$3,065
Monthly holding costs−$692
Monthly rent+$1,993
Out of pocket, every month −$1,764

Indicative only. Excludes tax, depreciation, vacancy and rate changes.

Want help running the numbers on a specific property?We pressure-test growth and yield together.

Book a free call
Useful resources

Do some of the homework yourself.

Two checks worth running before any purchase: how much public housing surrounds a property, and what the land underneath it is actually worth. Here's where to find both.

Public housing

A high concentration of public housing nearby can weigh on long-term capital growth. This map shows public housing percentages by area. Enter a suburb or address to check.

Open the public housing map

Finding land value

Land is what appreciates, so knowing the land value matters. The process differs by state. Here's where to look in each.

NSW
Step 1Find the property number via the Address Inquiry tool.
Step 2Look up the Land Value Search.
VIC
Step 1Request the Section 32 (Vendor Statement) from the sales agent.
Step 2Look at the Site Value in the Council Rates Notice or Land Tax Notice.
QLD
OnlineUse the Queensland Government's Find your land valuation tool.
TAS
PaidLog in to the LIST and purchase the title information.
WA
PaidLog in to Landgate and purchase the title information.
SA
OnlineSearch via SAILIS.
Offer letter template

Once you've done your research and you're ready to make an offer, send this to the sales agent. Copy it, fill in your details, and email it through.

Please find below our offer for the property advertised:
Property Address
Offer Amount
Deposit
Names on Contract
1 – Name
1 – Address
1 – Mobile
1 – Email
2 – Name
2 – Address
2 – Mobile
2 – Email
Trust / Company / SMSFCheck with your accountant on how to put on contract if purchasing via any of these entities
Conveyancer Details
Conveyancer Name
Conveyancer Address
Conveyancer Tel No.
Conveyancer Email
Conditions
Finance Clause
Building & Pest Inspection Clause
Settlement Date

Could you please send through the contract of sale so we may submit a formal offer to be considered by the vendor?

Buyer guides

Know the process before you sign.

Short, practical guides for buyers, covering the homework, the rules, and the day itself.

Victoria · AI tool

Section 32 red flag checker

A Section 32 Vendor Statement is long and dense. Grab our free master prompt, drop it into ChatGPT or Claude with the PDF, and get a plain-English read on the red flags before you talk to your conveyancer.

Open the checker

Want to discuss property data for your next purchase?

Start a conversation